Monitoring a workflow run
Monitoring can be done either from the Step Function Console through a Web Browser, or through command-line.
Command-line
General stats
tibanna stat [--sfn=<stepfunctioname>] [--status=RUNNING|SUCCEEDED|FAILED|TIMED_OUT|ABORTED] [-l] [-n <number_of_lines>] [-j <job_id> [<job_id2>] [...]]
The output is a table (an example below)
jobid       status  name    start_time      stop_time
2xPih7reR6FM        RUNNING md5        2018-08-15 17:45        2018-08-15 17:50
3hbkJB3hv92S        SUCCEEDED       hicprocessingbam   2018-08-15 16:04        2018-08-15 16:09
UlkvH3gbBBA2        FAILED  repliseq-parta     2018-08-09 18:26        2018-08-09 19:01
j7hvisheBV27        SUCCEEDED       bwa-mem    2018-08-09 18:44        2018-08-09 18:59
To print out more information, use the -l (long) option. The additional information includes the ID, type, status and public ip of the EC2 instance. Keyname and Password information is shown for ssh.
jobid       status  name    start_time      stop_time       instance_id     instance_type   instance_status ip      key     password
O37462jD9Kf7        RUNNING bwa-mem 2018-12-14 23:37        2018-12-14 23:40        i-009880382ee22a5b1     t2.large        running 3.25.66.32      4dn-encode      somepassword
jN4ubJNlNKIi        ABORTED bwa-mem 2018-12-14 23:33        2018-12-14 23:36        i-0df66d22d485bbc05     c4.4xlarge      shutting-down   -       -       -
dWBRxy0R8LXi        SUCCEEDED       bwa-mem 2018-12-14 22:44        2018-12-14 22:59        i-00f222fe5e4580007     t3.medium       terminated      -       -       -
Using -n limits the number of lines to be printed. (the most recent n items will be printed)
Execution logs
Log
Using your job ID, you can also check your S3 bucket to see if you can find a file named <jobid>.log. This will happen 5~10min after you start the process, because it takes time for an instance to be ready and send the log file to S3. The log file gets updated, so you can re-download this file and check the progress. Checking the log file can be done through the tibanna log command. For example, to view the last 60 lines of the log for job lSbkdVIQ6VtX,
tibanna log --job-id=lSbkdVIQ6VtX | tail -60
The output looks as below for version 1.0.0 or higher (much better organized / formatted than older version logs).
## job id: tvfZLFlt3PBz
## instance type: t3.micro
## instance id: i-0be6e6be5723ecd24
## instance region: us-east-1
## tibanna lambda version: 1.0.0
## awsf image: duplexa/tibanna-awsf:1.0.0
## ami id: ami-0a7ddfc7e412ab6e0
## availability zone: us-east-1f
## security groups: default
## log bucket: my-tibanna-test-bucket
## shutdown min: 30

## Starting...
Tue Nov  3 20:47:19 UTC 2020

...


## Running CWL/WDL/Snakemake/Shell commands

## workflow language: wdl
## Operating System: Ubuntu 20.04.1 LTS (containerized)
## Docker Root Dir: /mnt/data1/docker
## CPUs: 16
## Total Memory: 40.18GiB

...


INFO /usr/local/bin/cwltool 3.0.20201017180608
INFO Resolved 'workflow_gatk-GenotypeGVCFs_plus_vcf-integrity-check.cwl' to 'file:///mnt/data1/cwl/workflow_gatk-GenotypeGVCFs_plus_vcf-integrity-check.cwl'
INFO [workflow ] start
INFO [workflow ] starting step gatk-GenotypeGVCFs
INFO [step gatk-GenotypeGVCFs] start

...


22:12:34.599 WARN  InbreedingCoeff - Annotation will not be calculated, must provide at least 10 samples
22:12:34.599 WARN  InbreedingCoeff - Annotation will not be calculated, must provide at least 10 samples
22:12:34.600 WARN  InbreedingCoeff - Annotation will not be calculated, must provide at least 10 samples
22:12:34.601 WARN  InbreedingCoeff - Annotation will not be calculated, must provide at least 10 samples
22:12:35.852 INFO  ProgressMeter -      chr14:106769920             50.4              79043000        1567469.6
22:12:36.890 INFO  ProgressMeter -      chr14:106882957             50.4              79071726        1567501.5
22:12:36.890 INFO  ProgressMeter - Traversal complete. Processed 79071726 total variants in 50.4 minutes.
22:12:36.999 INFO  GenotypeGVCFs - Shutting down engine
[November 3, 2020 10:12:37 PM UTC] org.broadinstitute.hellbender.tools.walkers.GenotypeGVCFs done. Elapsed time: 50.48 minutes.
Runtime.totalMemory()=1915224064
Using GATK jar /miniconda3/share/gatk4-4.1.2.0-1/gatk-package-4.1.2.0-local.jar
To Download the log file manually, the following command also works.
aws s3 cp s3://<tibanna_lob_bucket_name>/<jobid>.log .
Top and Top_latest
As of version 1.0.0, the top command output is sent to <jobid>.top and <jobid>.top_latest in the log bucket. The top command output used to be mixed in the log file (<jobid>.log) in previous versions. With tibanna log command and option -t (all top output) and -T (latest only), one can print out the top command output from the running instance. The data is collected at 1-minute intervals and only while the command is running (e.g. not while the input data are downloaded to the EC2 instance or ssh is being configured etc).
To use this feature, the tibanna unicorn must be deployed with tibanna >= 1.0.0 and the locally installed version must be >= 1.0.0 as well.
Below is an example command and the output, executed twice with a 1-minute interval. In this example, the user can see that around 20:49:01, unpigz was running and around 20:50:01, many java processes were running (they depend on the command / workflow).
tibanna log -j OiHYCN1QoEiP -T
Timestamp: 2021-01-20-20:49:01
top - 20:49:01 up 1 min,  0 users,  load average: 2.11, 0.75, 0.27
Tasks:  15 total,   2 running,  13 sleeping,   0 stopped,   0 zombie
%Cpu(s): 13.1 us,  6.4 sy,  0.0 ni, 80.5 id,  0.0 wa,  0.0 hi,  0.0 si,  0.0 st
MiB Mem :  41139.5 total,  32216.5 free,    675.9 used,   8247.1 buff/cache
MiB Swap:      0.0 total,      0.0 free,      0.0 used.  39951.0 avail Mem

    PID USER      PR  NI    VIRT    RES    SHR S  %CPU  %MEM     TIME+ COMMAND
     54 root      20   0 2928856 102488  48260 S 186.7   0.2   0:44.95 dockerd
    858 root      20   0   28904   1228   1128 R 153.3   0.0   0:09.18 unpigz
    859 root      20   0 1673140  80084  44464 S  46.7   0.2   0:02.91 exe
      1 root      20   0    7104   3692   3348 S   0.0   0.0   0:00.02 run.sh
     94 root      20   0 1781488  45328  25740 S   0.0   0.1   0:00.12 contain+
    319 root      20   0 1792992  14660   9056 S   0.0   0.0   0:00.10 goofys-+
    325 root      20   0 1571284  14136   9080 S   0.0   0.0   0:00.08 goofys-+
    382 root      20   0    6812   2076   1868 S   0.0   0.0   0:00.00 cron
If we run the command again in ~1 min, we may get a different snapshot. This way, we can monitor in near-real time what kind of programs are running and how much resources they are using.
tibanna log -j OiHYCN1QoEiP -T
Timestamp: 2021-01-20-20:50:01
top - 20:50:01 up 2 min,  0 users,  load average: 18.06, 4.84, 1.67
Tasks:  45 total,   1 running,  44 sleeping,   0 stopped,   0 zombie
%Cpu(s): 93.6 us,  6.4 sy,  0.0 ni,  0.0 id,  0.0 wa,  0.0 hi,  0.0 si,  0.0 st
MiB Mem :  41139.5 total,  16099.9 free,  16978.6 used,   8061.1 buff/cache
MiB Swap:      0.0 total,      0.0 free,      0.0 used.  23657.1 avail Mem

    PID USER      PR  NI    VIRT    RES    SHR S  %CPU  %MEM     TIME+ COMMAND
   2085 root      20   0 7984200   1.1g  31356 S 253.3   2.8   0:28.85 java
   2114 root      20   0 7984200   1.2g  31512 S 206.7   2.9   0:25.40 java
   2095 root      20   0 7984200   1.2g  31328 S 186.7   3.0   0:24.46 java
   2208 root      20   0 7984200   1.1g  31356 S 133.3   2.8   0:27.61 java
   2121 root      20   0 7984200   1.2g  31480 S 120.0   2.9   0:26.81 java
   2189 root      20   0 7984200   1.2g  31372 S 120.0   3.0   0:30.18 java
   2122 root      20   0 7984200   1.1g  31232 S 100.0   2.8   0:28.88 java
   2148 root      20   0 7984200   1.0g  31284 S 100.0   2.5   0:29.71 java
Postrun.json
Once the job is finished, you should be able to find the <jobid>.postrun.json file as well. This file can be viewed likewise using the tibanna log command, but with the -p option. The postrun json file contains the summary of the run, including the input / output / EC2 configuration and Cloudwatch metrics for memory/CPU/disk space usage.
Starting version 1.0.0, you can get an incomplete postrun.json before the job is finished, in addition to a complete postrun.json that you get at the end of the run. The incomplete postrun.json will not have the metrics, job status, end time, etc, but will include instance ID and file system.
tibanna log -p --job-id=lSbkdVIQ6VtX
{
    "Job": {
        "status": "0",
        "Metrics": {
            "max_cpu_utilization_percent": 86.4,
            "max_mem_used_MB": 14056.421875,
            "max_mem_utilization_percent": 45.124831006539534,
            "max_disk_space_utilization_percent": 72.0912267060547,
            "total_mem_MB": 31150.08203125,
            "max_mem_available_MB": 17093.66015625,
            "max_disk_space_used_GB": 64.4835815429688
        },
        "total_tmp_size": "4.0K",
        "Log": {
            "log_bucket_directory": "tibanna-output"
        },
        "App": {
            "main_wdl": "atac.wdl",
            "other_cwl_files": "",
            "App_name": "encode-atacseq-postaln",
            "language": "wdl",
            "other_wdl_files": "",
            "main_cwl": "",
            "cwl_url": "",
            "wdl_url": "https://raw.githubusercontent.com/4dn-dcic/atac-seq-pipeline/master/",
            "App_version": "1.1.1"
        },
        "filesystem": "/dev/nvme1n1",
        "JOBID": "lSbkdVIQ6VtX",
        "instance_id": "i-06fc45b29b47a1703",
        "end_time": "20190204-17:11:01-UTC",
        "total_input_size": "829M",
        "Input": {
            "Input_files_data": {
                "atac.chrsz": {
                    "profile": "",
                    "path": "9866d158-da3c-4d9b-96a9-1d59632eabeb/4DNFIZJB62D1.chrom.sizes",
                    "rename": "",
                    "class": "File",
                    "dir": "elasticbeanstalk-fourfront-webprod-files"
                },
                "atac.blacklist": {
                    "profile": "",
                    "path": "9562ffbd-9f7a-4bd7-9c10-c335137d8966/4DNFIZ1TGJZR.bed.gz",
                    "rename": "",
                    "class": "File",
                    "dir": "elasticbeanstalk-fourfront-webprod-files"
                },
                "atac.tas": {
                    "profile": "",
                    "path": [
                        "b08d0ea3-2d95-4306-813a-f2e956a705a9/4DNFIZYWOA3Y.bed.gz",
                        "0565b17b-4012-4d4d-9914-a4a993717db8/4DNFIZDSO341.bed.gz"
                    ],
                    "rename": [
                        "4DNFIZYWOA3Y.tagAlign.gz",
                        "4DNFIZDSO341.tagAlign.gz"
                    ],
                    "class": "File",
                    "dir": "elasticbeanstalk-fourfront-webprod-wfoutput"
                }
            },
            "Secondary_files_data": {
                "atac.tas": {
                    "profile": "",
                    "path": [
                        null,
                        null
                    ],
                    "rename": [
                        "4DNFIZYWOA3Y.tagAlign.gz",
                        "4DNFIZDSO341.tagAlign.gz"
                    ],
                    "class": "File",
                    "dir": "elasticbeanstalk-fourfront-webprod-wfoutput"
                }
            },
            "Env": {},
            "Input_parameters": {
                "atac.pipeline_type": "atac",
                "atac.paired_end": true,
                "atac.enable_xcor": false,
                "atac.disable_ataqc": true,
                "atac.gensz": "hs"
            }
        },
        "Output": {
            "output_target": {
                "atac.conservative_peak": "b8a245d2-89c3-44d3-886c-4cd895f9d535/4DNFICOQGQSK.bb",
                "atac.qc_json": "2296ea28-d09a-41ba-afb9-1cbfafb1898b/atac.qc_json16152683435",
                "atac.report": "2296ea28-d09a-41ba-afb9-1cbfafb1898b/atac.report34127308390",
                "atac.optimal_peak": "65023676-be5c-4497-927c-a796a4c302fe/4DNFIY43X8IO.bb",
                "atac.sig_fc": "166659d9-2d6f-440f-b404-b7fe0109e8c5/4DNFI5BWWMR7.bw"
            },
            "secondary_output_target": {},
            "output_bucket_directory": "elasticbeanstalk-fourfront-webprod-wfoutput",
            "Output files": {
                "atac.conservative_peak": {
                    "path": "/data1/wdl/cromwell-executions/atac/14efe06b-a010-42c9-be0f-82f33f4d877c/call-reproducibility_overlap/execution/glob-c12e49ae1deb87ae04019b575ae1ffe9/conservative_peak.narrowPeak.bb",
                    "target": "b8a245d2-89c3-44d3-886c-4cd895f9d535/4DNFICOQGQSK.bb"
                },
                "atac.qc_json": {
                    "path": "/data1/wdl/cromwell-executions/atac/14efe06b-a010-42c9-be0f-82f33f4d877c/call-qc_report/execution/glob-3440f922973abb7a616aaf203e0db08b/qc.json",
                    "target": "2296ea28-d09a-41ba-afb9-1cbfafb1898b/atac.qc_json16152683435"
                },
                "atac.report": {
                    "path": "/data1/wdl/cromwell-executions/atac/14efe06b-a010-42c9-be0f-82f33f4d877c/call-qc_report/execution/glob-eae855c82d0f7e2185388856e7b2cc7b/qc.html",
                    "target": "2296ea28-d09a-41ba-afb9-1cbfafb1898b/atac.report34127308390"
                },
                "atac.optimal_peak": {
                    "path": "/data1/wdl/cromwell-executions/atac/14efe06b-a010-42c9-be0f-82f33f4d877c/call-reproducibility_overlap/execution/glob-6150deffcc38df7a1bcd007f08a547cd/optimal_peak.narrowPeak.bb",
                    "target": "65023676-be5c-4497-927c-a796a4c302fe/4DNFIY43X8IO.bb"
                },
                "atac.sig_fc": {
                    "path": "/data1/wdl/cromwell-executions/atac/14efe06b-a010-42c9-be0f-82f33f4d877c/call-macs2_pooled/execution/glob-8876d8ced974dc46a0c7a4fac20a3a95/4DNFIZYWOA3Y.pooled.fc.signal.bigwig",
                    "target": "166659d9-2d6f-440f-b404-b7fe0109e8c5/4DNFI5BWWMR7.bw"
                }
            },
            "alt_cond_output_argnames": []
        },
        "total_output_size": "232K",
        "start_time": "20190204-15:28:30-UTC"
    },
    "config": {
        "ebs_size": 91,
        "cloudwatch_dashboard": true,
        "ami_id": "ami-0f06a8358d41c4b9c",
        "language": "wdl",
        "json_bucket": "4dn-aws-pipeline-run-json",
        "json_dir": "/tmp/json",
        "EBS_optimized": true,
        "ebs_iops": "",
        "userdata_dir": "/tmp/userdata",
        "shutdown_min": "now",
        "instance_type": "c5.4xlarge",
        "public_postrun_json": true,
        "ebs_type": "gp2",
        "script_url": "https://raw.githubusercontent.com/4dn-dcic/tibanna/master/awsf/",
        "job_tag": "encode-atacseq-postaln",
        "log_bucket": "tibanna-output"
    },
    "commands": []
}
To Download the postrun json file manually, the following command also works.
aws s3 cp s3://<tibanna_lob_bucket_name>/<jobid>.postrun.json .
EC2 Spot failure detection
From Tibanna version 1.6.0, a cron job on the EC2 will regularly check for Spot Instance interruption notices issued by AWS (in case the workflow on a Spot instance). In such an event, the EC2 spot instance is going to be terminated by AWS and the workflow run will most likely fail. In this case Tibanna creates a file called <jobid>.spot_failure in the log bucket.
DEBUG tar ball
For WDL, a more comprehensive log is provided as <jobid>.debug.tar.gz in the same log bucket, starting from version 0.5.3. This file is a tar ball created by the following command on the EC2 instance:
cd /data1/wdl/
find . -type f -name 'stdout' -or -name 'stderr' -or -name 'script' -or \
-name '*.qc' -or -name '*.txt' -or -name '*.log' -or -name '*.png' -or -name '*.pdf' \
| xargs tar -zcvf debug.tar.gz
You can download this file using a aws s3 cp command.
aws s3 cp s3://<tibanna_lob_bucket_name>/<jobid>.debug.tar.gz .
Detailed monitoring through ssh
You can also ssh into your running instance to check more details. The IP of the instance can be found using tibanna stat -v
ssh ubuntu@<ip>
if keyname was provided in the input execution json,
ssh -i <keyfilename>.pem ubuntu@<ip>
The keyname (and/or password) can also be found using tibanna stat -v.
Alternatively, the Step Function execution page of AWS Web Console contains details of the ssh options. keyname and password can be found inside the input json of the execution. The IP can be found inside the output json of the RunTaskAwsem step or the input json of the CheckTaskAwsem step.
The purpose of the ssh is to monitor things, so refrain from doing various things there, which could interfere with the run. It is recommended, unless you’re a developer, to use the log file than ssh.
The instance may be set to run for some time after the run finishes, to allow debugging time with the ssh option. This parameter (in minutes) can be set in the shutdown_min field inside the config field of the input execution json.
On the instance, one can check the following, for example.
For CWL,
/data1/input/: input files/data1/tmp*: temp/intermediate files (need sudo access)/data1/output/: output files (need sudo access)top: to see what processes are running and how much cpu/memory is being usedps -fe: to see what processes are running, in more detail
For WDL,
/data1/input/: input files/data1/wdl/cromwell-execution/*: temp/intermediate files, output files and logstop: to see what processes are running and how much cpu/memory is being usedps -fe: to see what processes are running, in more detail
Console
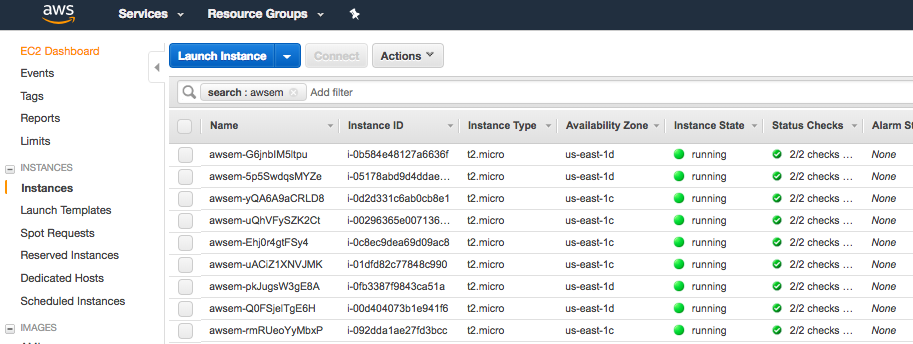
EC2 instances
You can also check from the Console the instance that is running which has a name awsem-<jobid>. It will terminate itself when the run finishes. You won’t have access to terminate this or any other instance, but if something is hanging for too long, please contact the admin to resolve the issue.
Step functions
When the run finishes successfully, you’ll see in your bucket a file <jobid>.success. If there was an error, you will see a file <jobid>.error instead. The step functions will look green on every step, if the run was successful. If one of the steps is red, it means it failed at that step.
| Success | Fail |
|---|---|
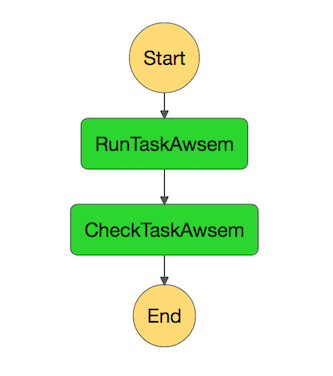 |
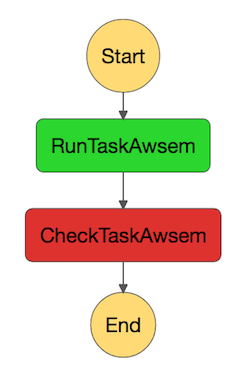 |
Cloud Watch
Cloudwatch dashboard option is now disabled and replaced by the resource metric report that is generated by the plot_metrics command (below Resource Metrics Report section).
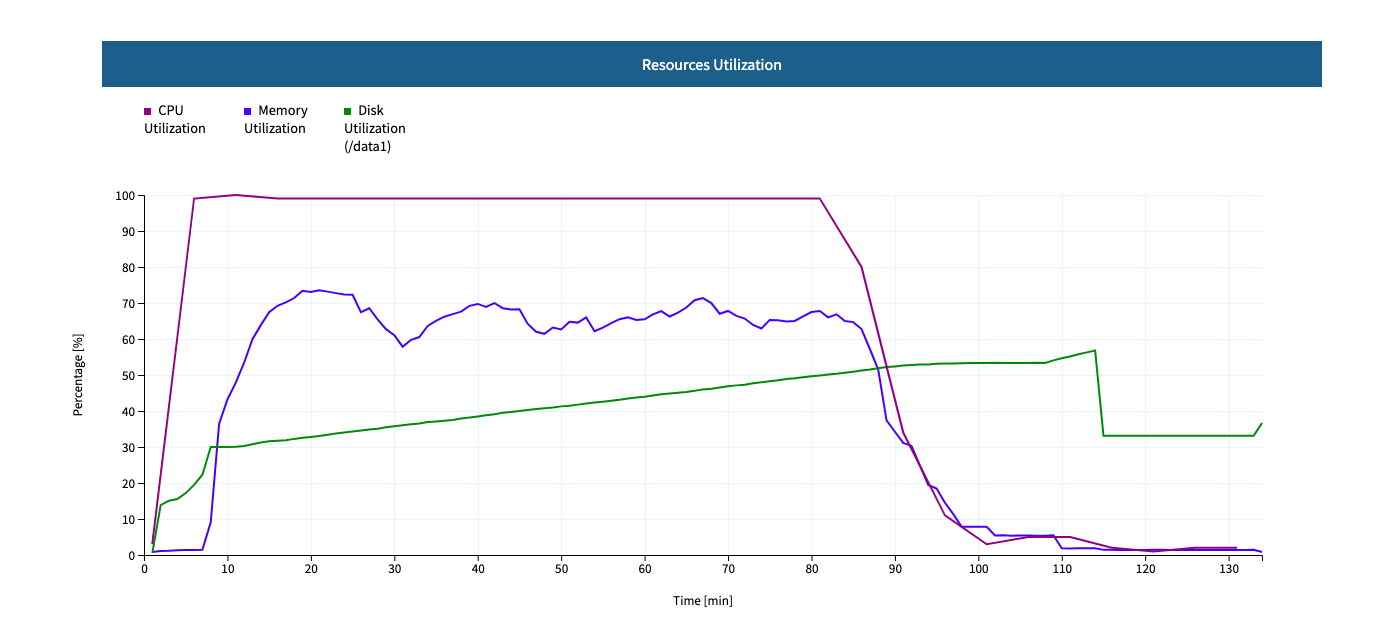
Resource Metrics Report
Tibanna can collect Cloud Watch metrics on used resources in real time for each run. The metrics are saved as tsv files together with an html report automatically created for visualization. The metrics are collected by 1 minute interval or 5 minute interval depending on the availability on Cloud Watch. The metrics and html files created are uploaded to an S3 bucket.
plot_metrics
This command allows to save Cloud Watch data collected in the required time interval and creates an html report for the visualization.
By default the command will retrieve the data from cloud watch, and creates several files:
- a metrics.tsv file containing all the data points
- a metrics_report.tsv containing the average statistics and other information about the EC2 instance
- a metrics.html report for visualization
All the files are eventually uploaded to a folder named <jobid>.metrics inside the log S3 bucket specified for tibanna output.
To visualize the html report the URL structure is: https://<log-bucket>.s3.amazonaws.com/<jobid>.metrics/metrics.html
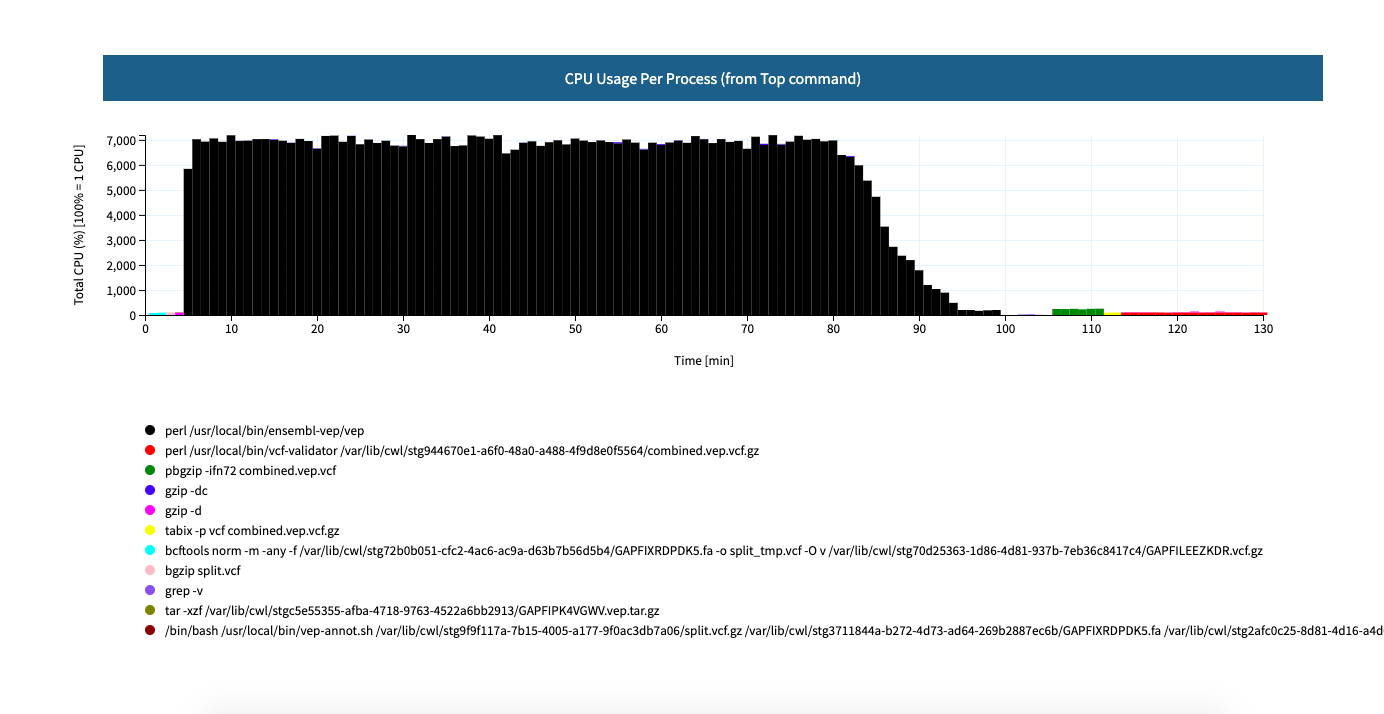
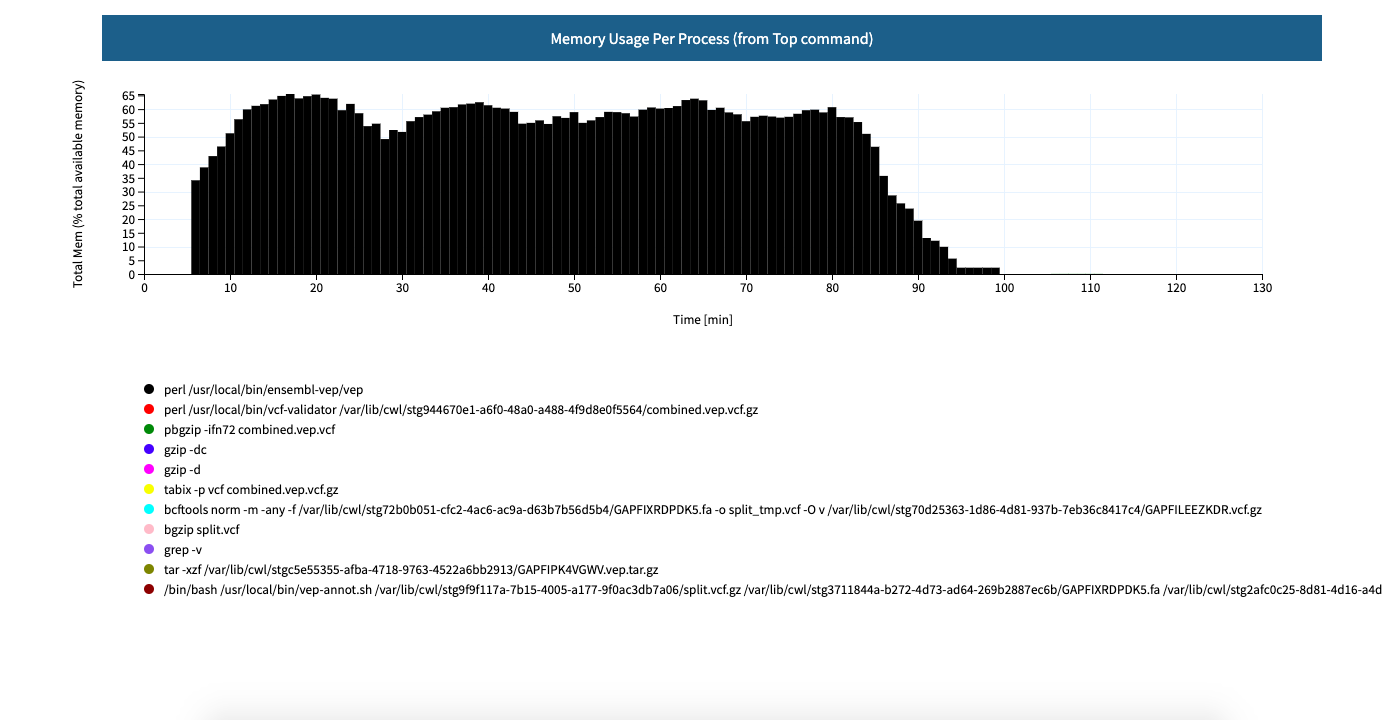
Starting with 1.0.0, the metrics plot will include per-process CPU and memory profiles retrieved from the top command reports at a 1-minute interval. Additional files top_cpu.tsv and top_mem.tsv will also be created under the same folder <jobid>.metrics.
From version 2.1.0, the metrics that are send to cloud watch are defined here: https://raw.githubusercontent.com/4dn-dcic/tibanna/master/awsf3/cloudwatch_agent_config.json. Note that not every metric that is available in cloud watch is displayed in the report created by plot_metrics.
Basic Command
tibanna plot_metrics --job-id=<jobid> [<options>]
Options
-s|--sfn=<stepfunctionname>         An example step function name may be
                                    'tibanna_unicorn_defaut_3978'. If not specified, default
                                    value is taken from environmental variable
                                    TIBANNA_DEFAULT_STEP_FUNCTION_NAME. If the environmental
                                    variable is not set, it uses name 'tibanna_pony' (4dn
                                    default, works only for 4dn).

-f|--force-upload                   Upload the metrics reports to the S3 bucket even
                                    if there is a lock file (upload is blocked by default
                                    by the lock)

-u|--update-html-only               Update only the html file for metrics visualization

-B|--do-not-open-browser            Do not open the browser to visualize the metrics html
                                    after it has been created/updated

-e|--endtime=<end_time>             Endtime (default job end time if the job has finished
                                    or the current time)
-i|--instance-id=<instance_id>      Manually provide instance_id if somehow tibanna fails
                                    to retrieve the info
When metrics are collected for a run that is complete, a lock file is automatically created inside the same folder. The command will not update the metrics files if a lock file is present. To override this behavior the --force-upload flag allows to upload the metrics files ignoring the lock.
The --update-html-only allows to only update the metrics.html file without modifying the other tsv files.
By default the command will open the html report in the browser for visualization when execution is complete, --do-not-open-browser can be added to prevent this behavior.
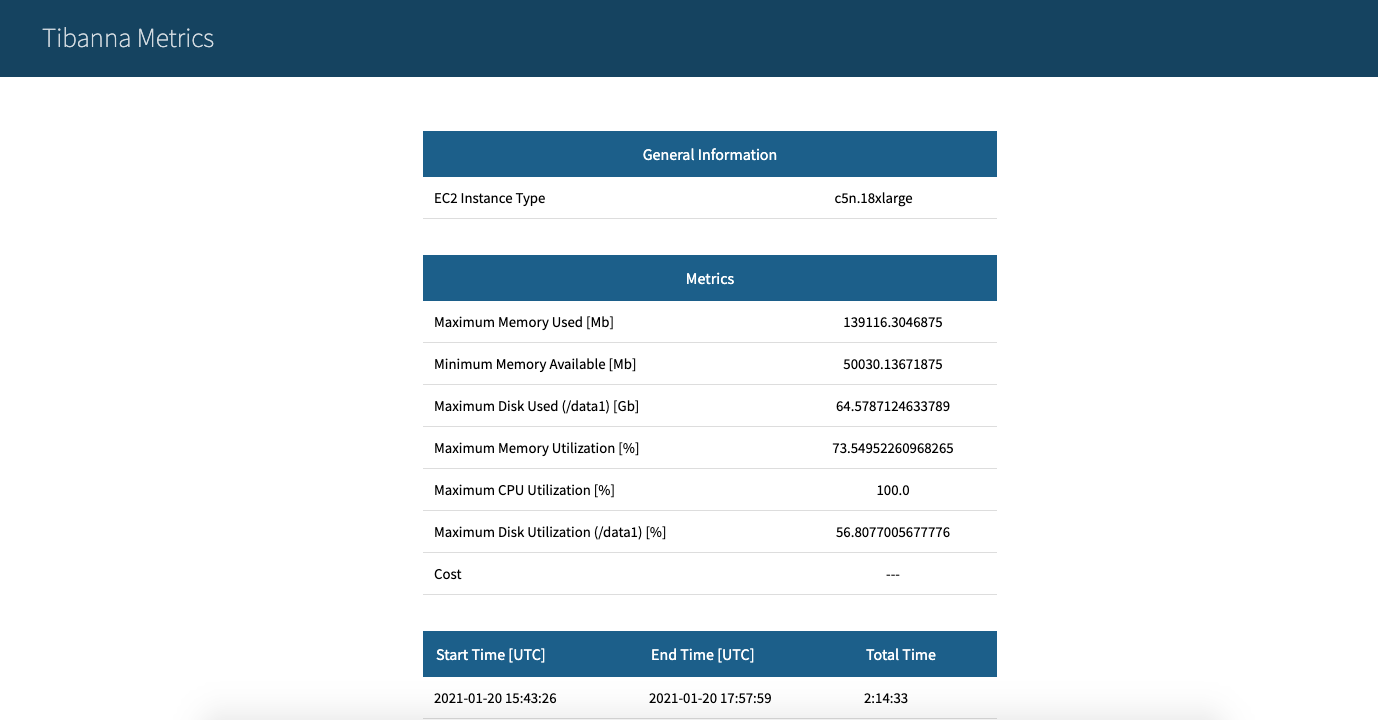
Summary metrics collected as a table
Some summary metrics are collected and shown in the table of at the beginning of the metrics report. They are:
- EC2 Instance type
- Memory, Disk, and CPU utilization as a percentage of the maximum resources available for the EC2 instance
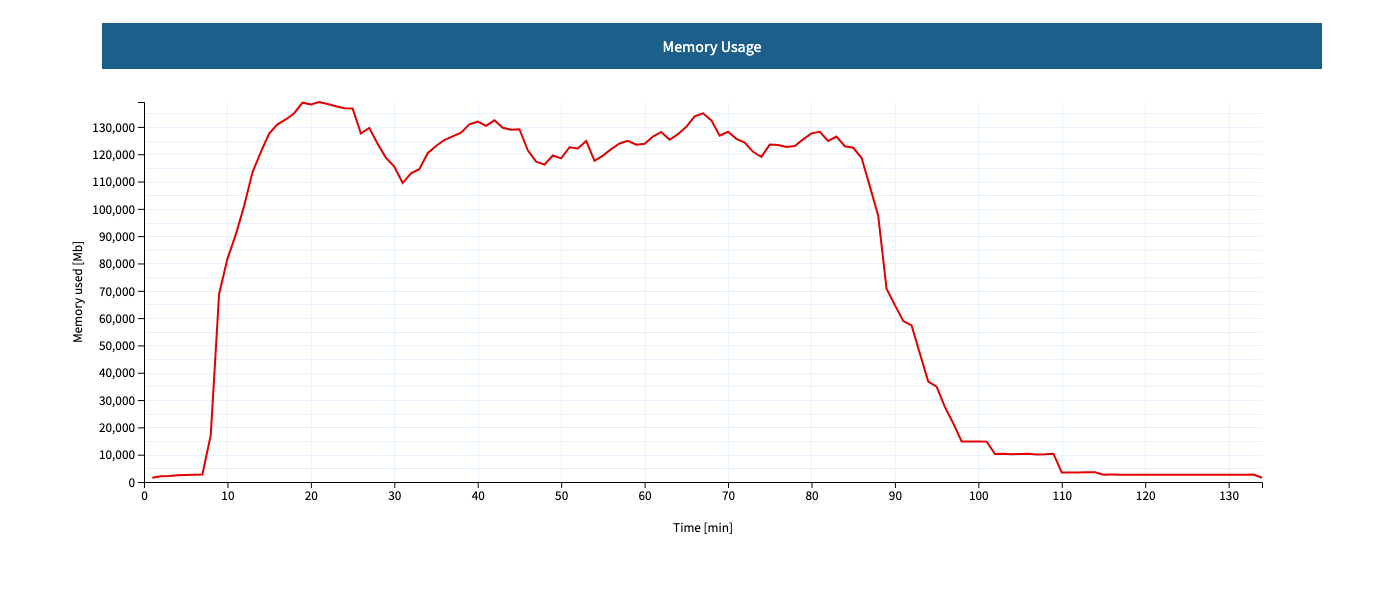
- Memory used in Mb
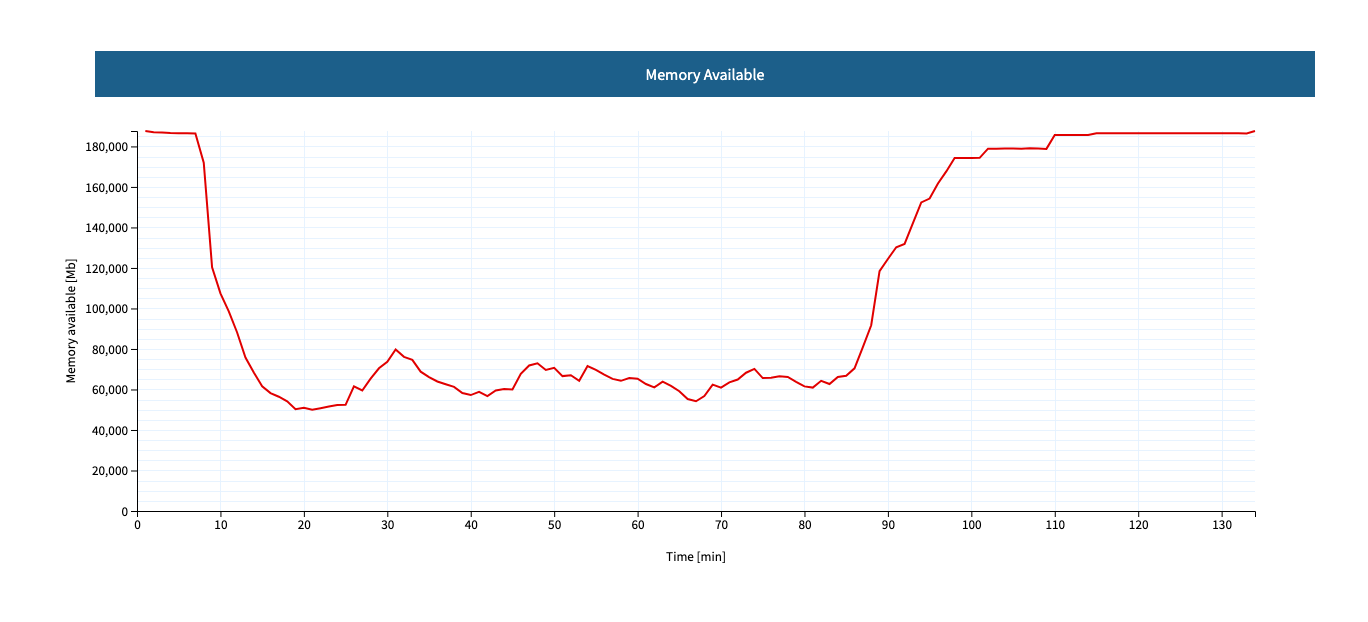
- Memory available in Mb
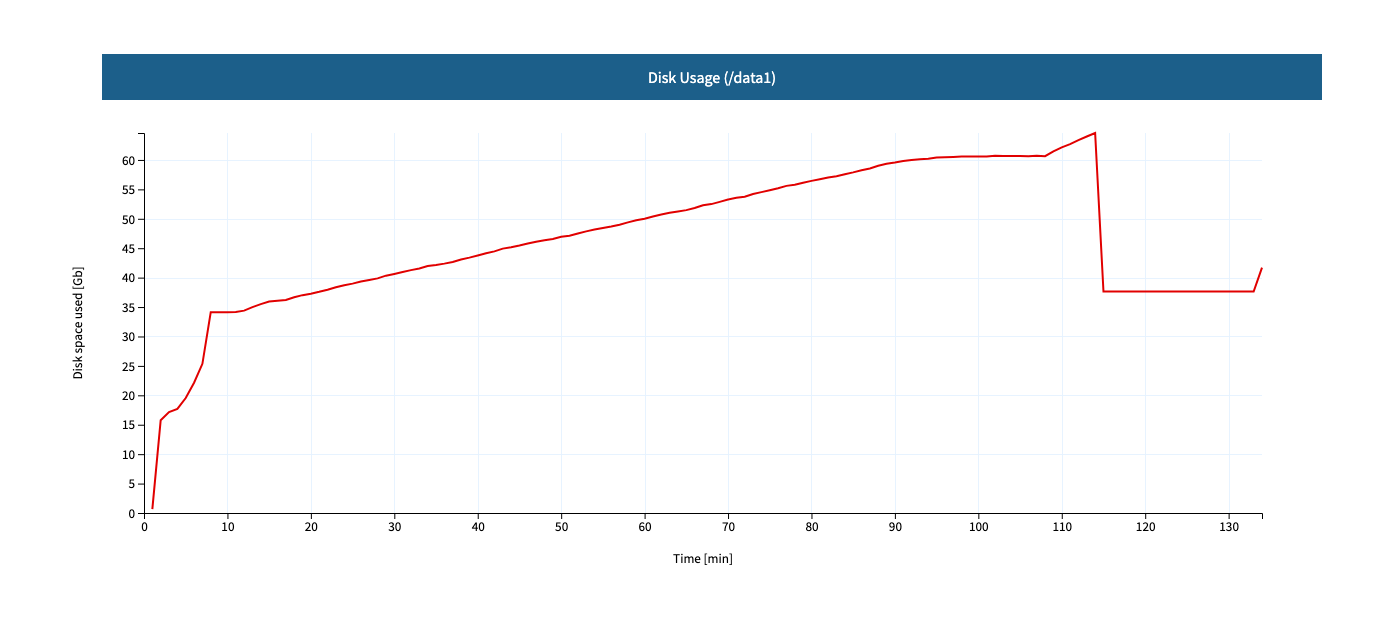
- Disk used in Gb
- Start time, end time, and total elapsed time
cost
This command allows to retrieve the cost for the run. The cost is not immediately ready and usually requires few days to become available. The command eventually allows to update the information obtained with plot_metrics by adding the cost.
tibanna cost --job-id=<jobid> [<options>]
Options
-s|--sfn=<stepfunctionname>         An example step function name may be
                                    'tibanna_unicorn_defaut_3978'. If not specified, default
                                    value is taken from environmental variable
                                    TIBANNA_DEFAULT_STEP_FUNCTION_NAME. If the environmental
                                    variable is not set, it uses name 'tibanna_pony' (4dn
                                    default, works only for 4dn).

-u|--update-tsv                     Update with the cost the tsv file that stores metrics
                                    information on the S3 bucket